CSAT Reports
If you have enabled CSAT surveys in your inboxes, you can analyze the results using the CSAT report.
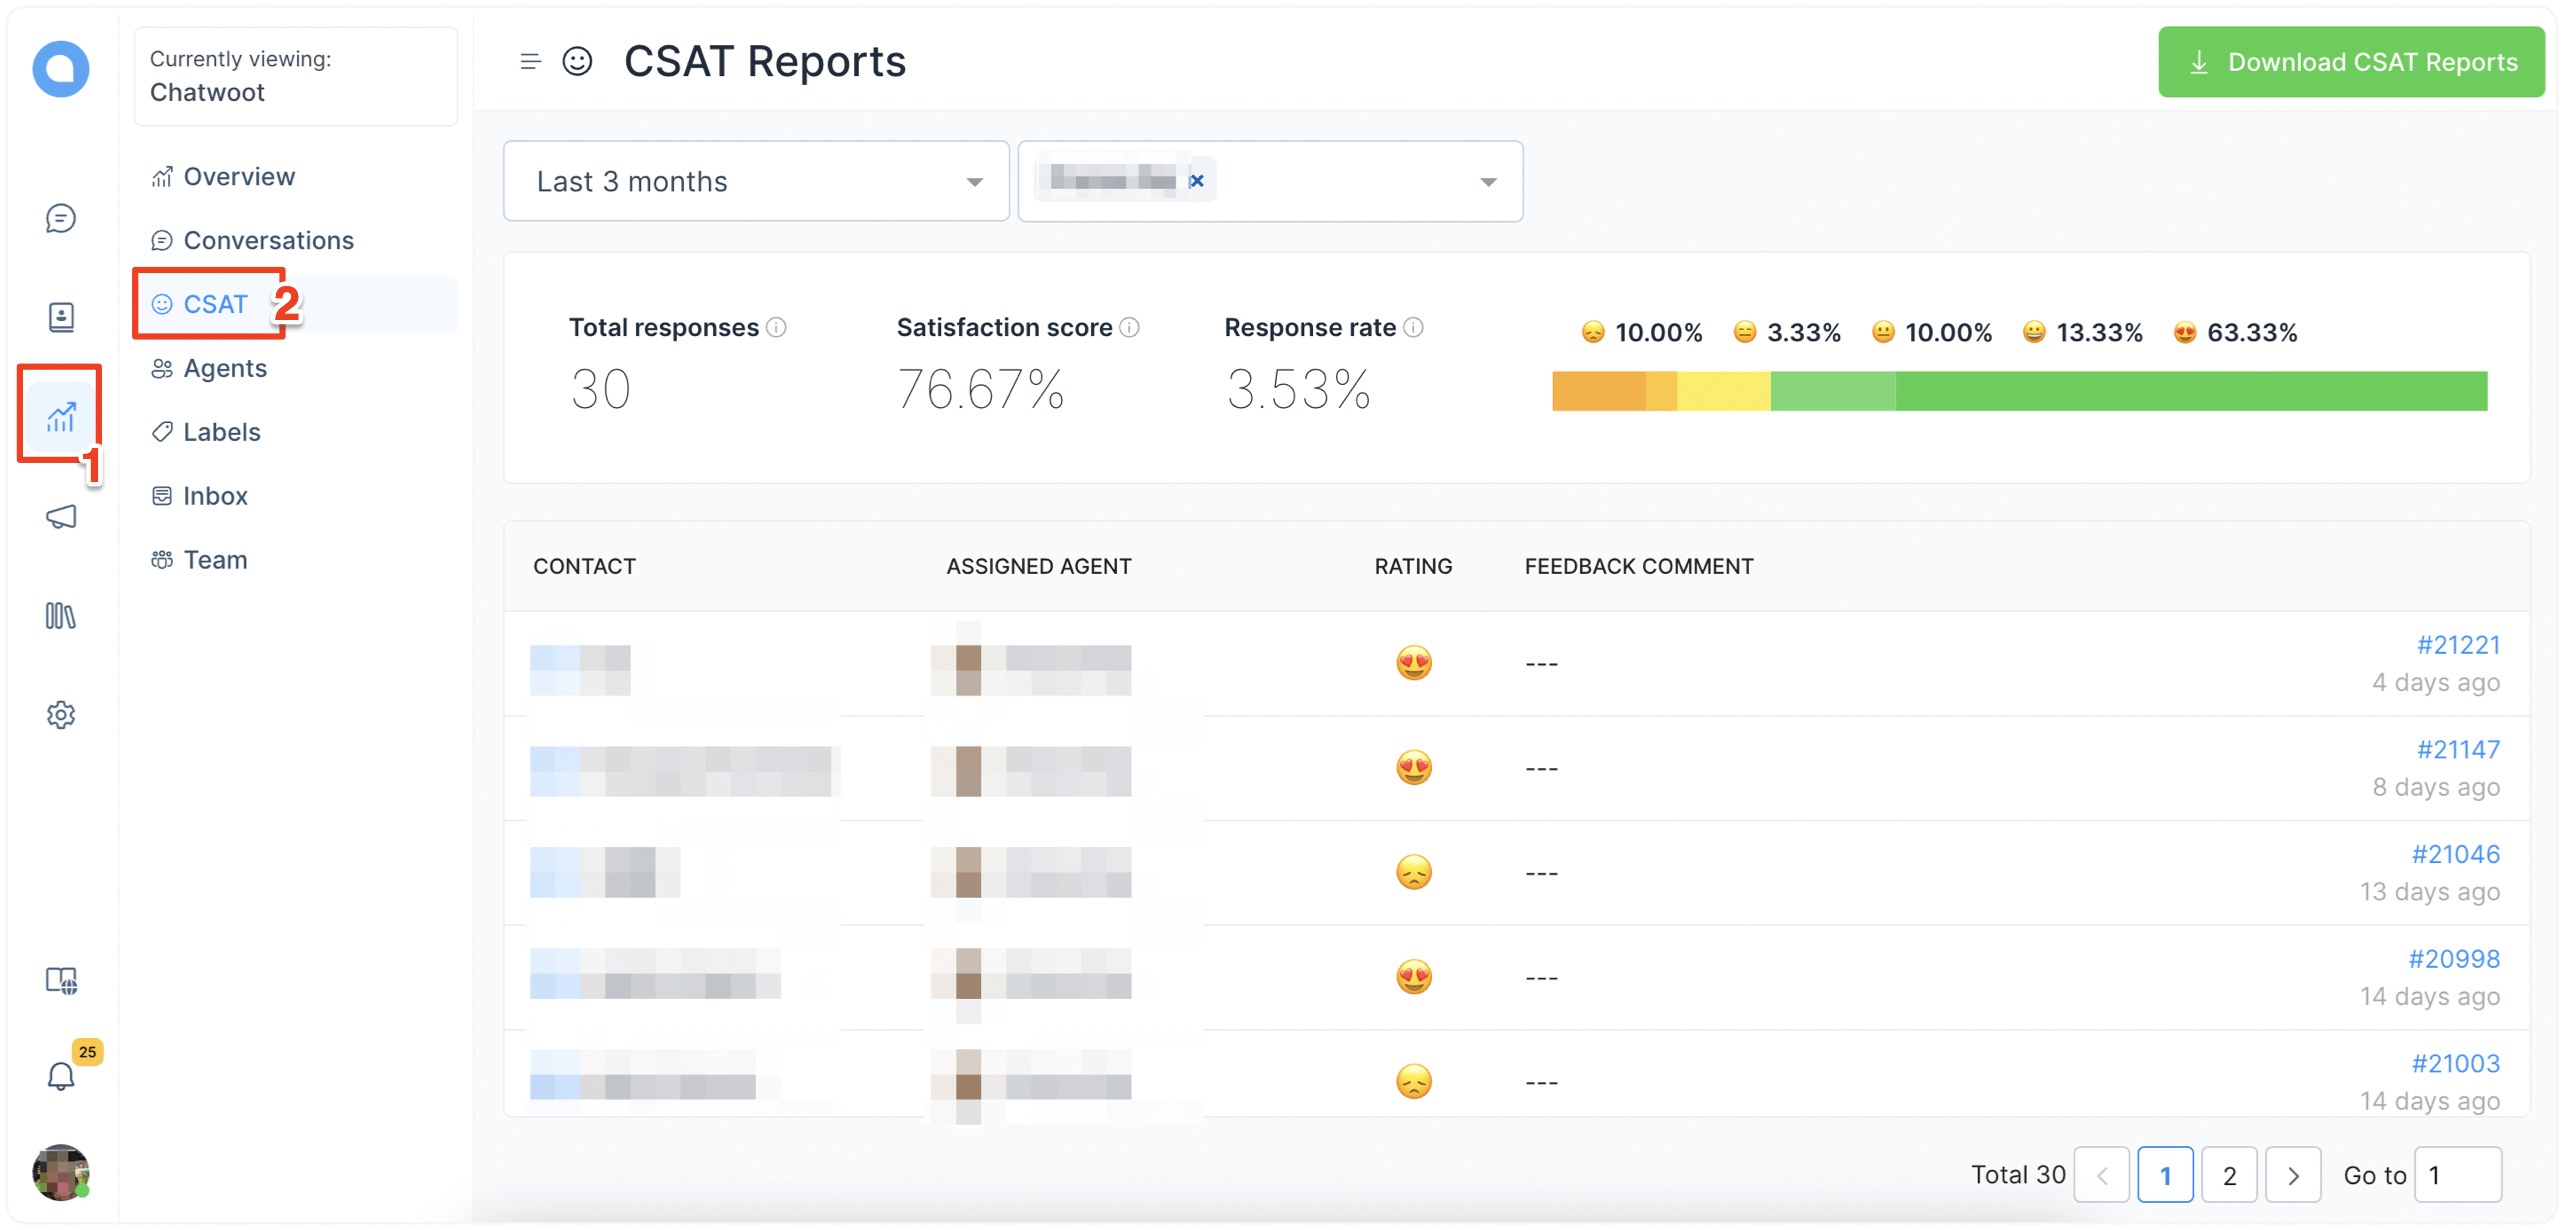
To view the CSAT Report, go to Reports → CSAT. This is what it looks like:
Customizing CSAT Reports
CSAT reports can be filtered by the following metrics.
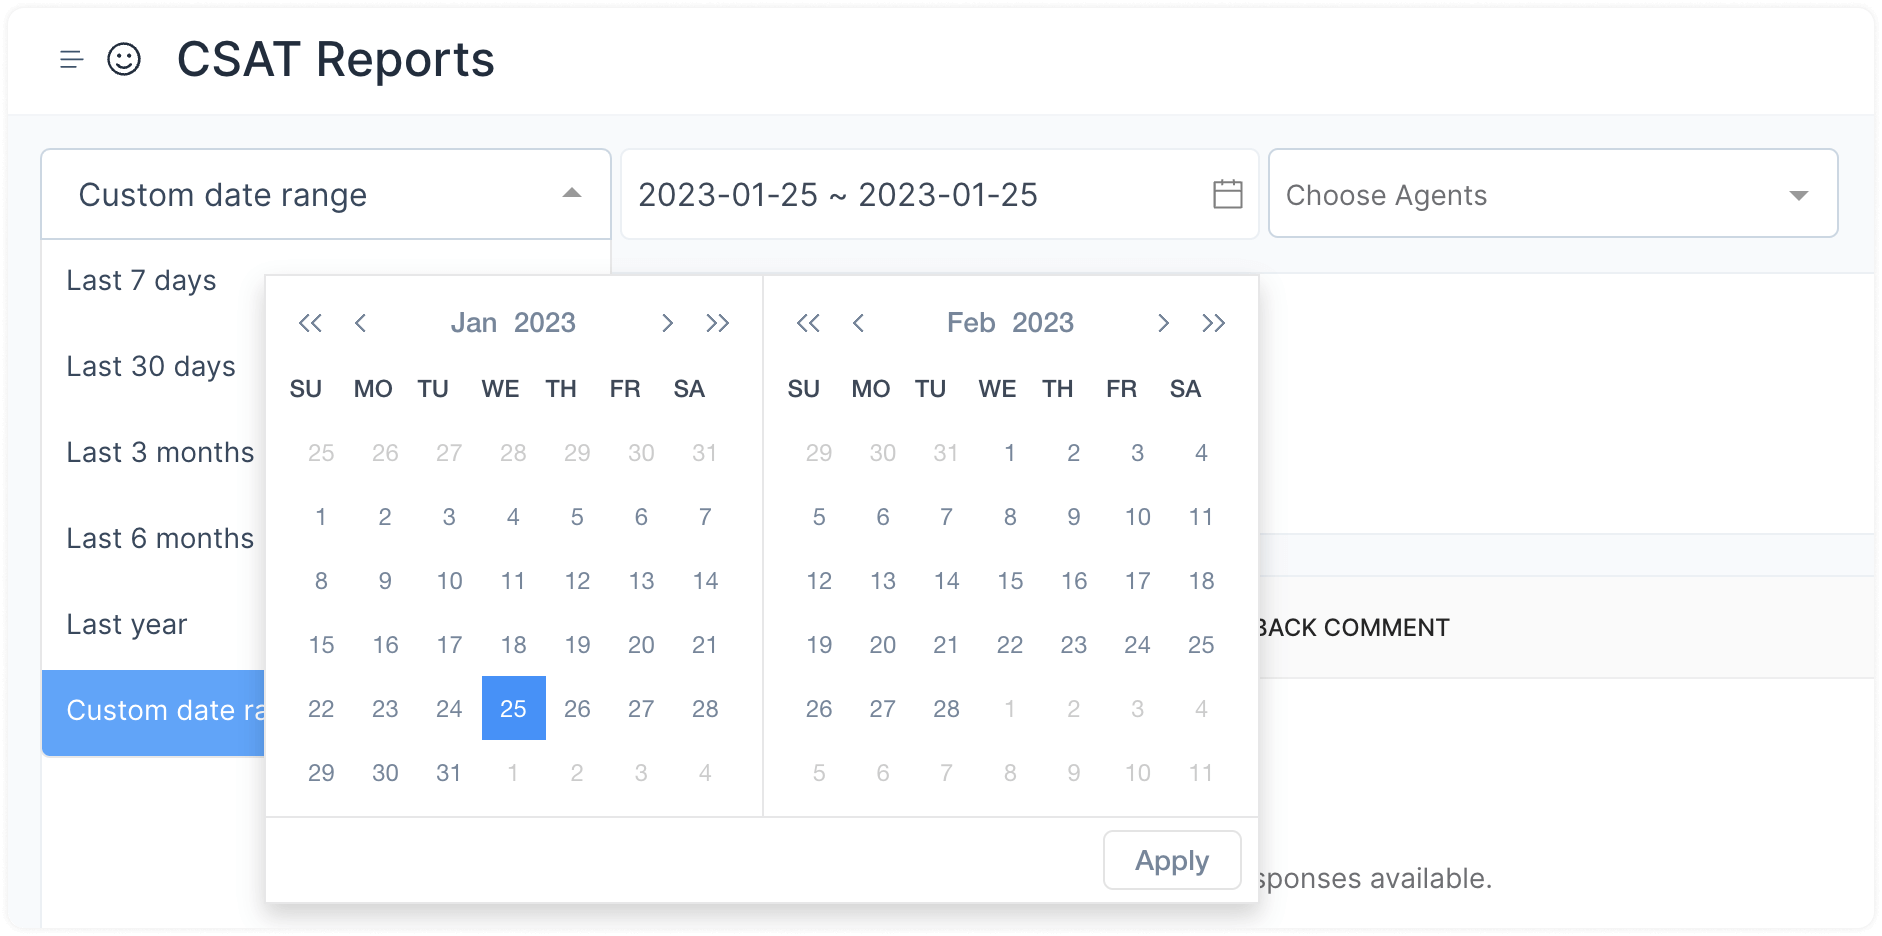
Duration
You can select the duration you want to see the report for. By default, this is set for the last 7 days.
Agents
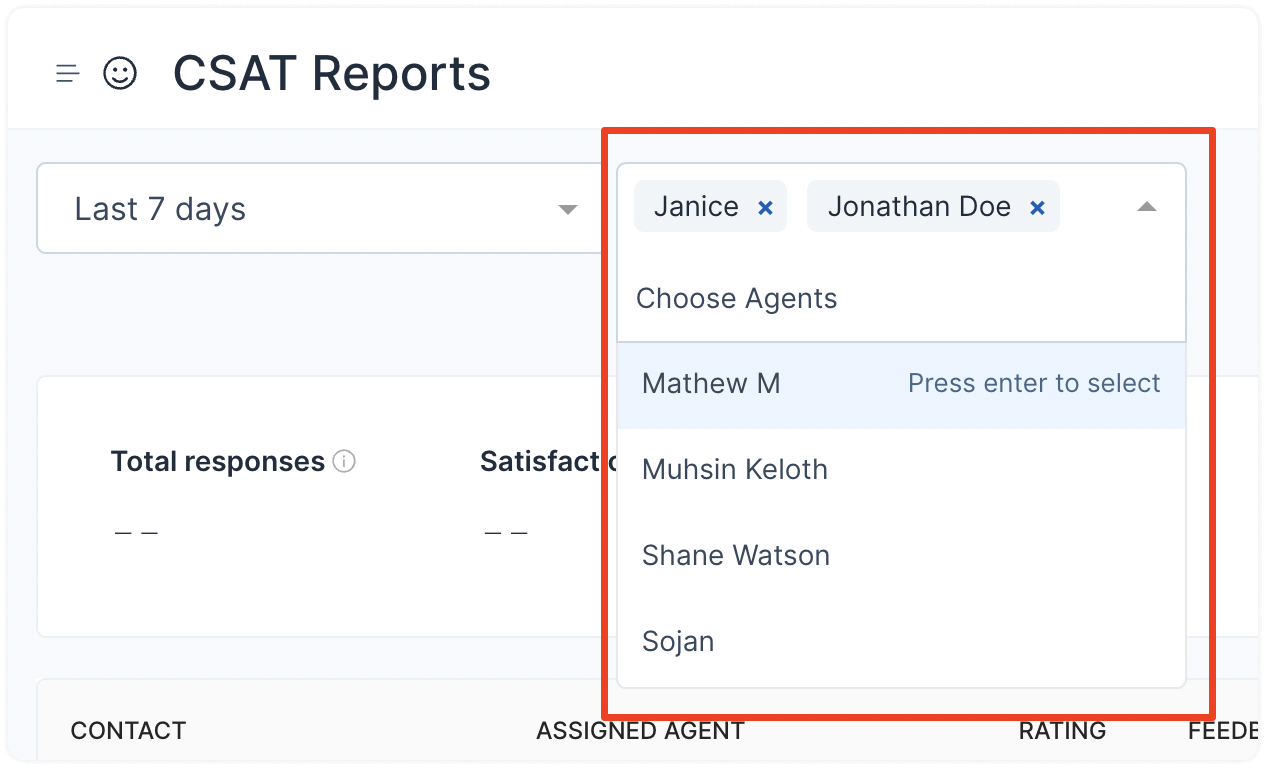
You can analyze the CSAT reports for particular agents only. Select one or more agent names from the dropdown.
Metrics in the CSAT Report
Quick Overview
The upper half of your report will show metrics like this screenshot.

The following list explains what each metric means.
Total responses
This is the total number of responses received on your CSAT surveys, during the selected period and for the selected agent or agents.
Satisfaction score
This is the mean satisfaction score the survey takers gave, calculated using the following formula.
(Total number of positive ratings/Total number of responses) * 100
Response rate
This indicates the proportion of customers that responded to the CSAT surveys sent. It is calculated using the following formula.
(Total number of responses/Total number of CSAT survey requests sent) * 100
Emoji scale
Whenever a CSAT survey is requested from a customer, they are asked to rate their experience on an emoji scale like this:

The emoji scale metrics that you see on your CSAT report show how many people (in percentage) used which emoji to rate their experience.
Details of responses
The lower half of your report will list all the responses received. For eg., The screenshot below lists the CSAT survey responses received for agent Pranav Raj.
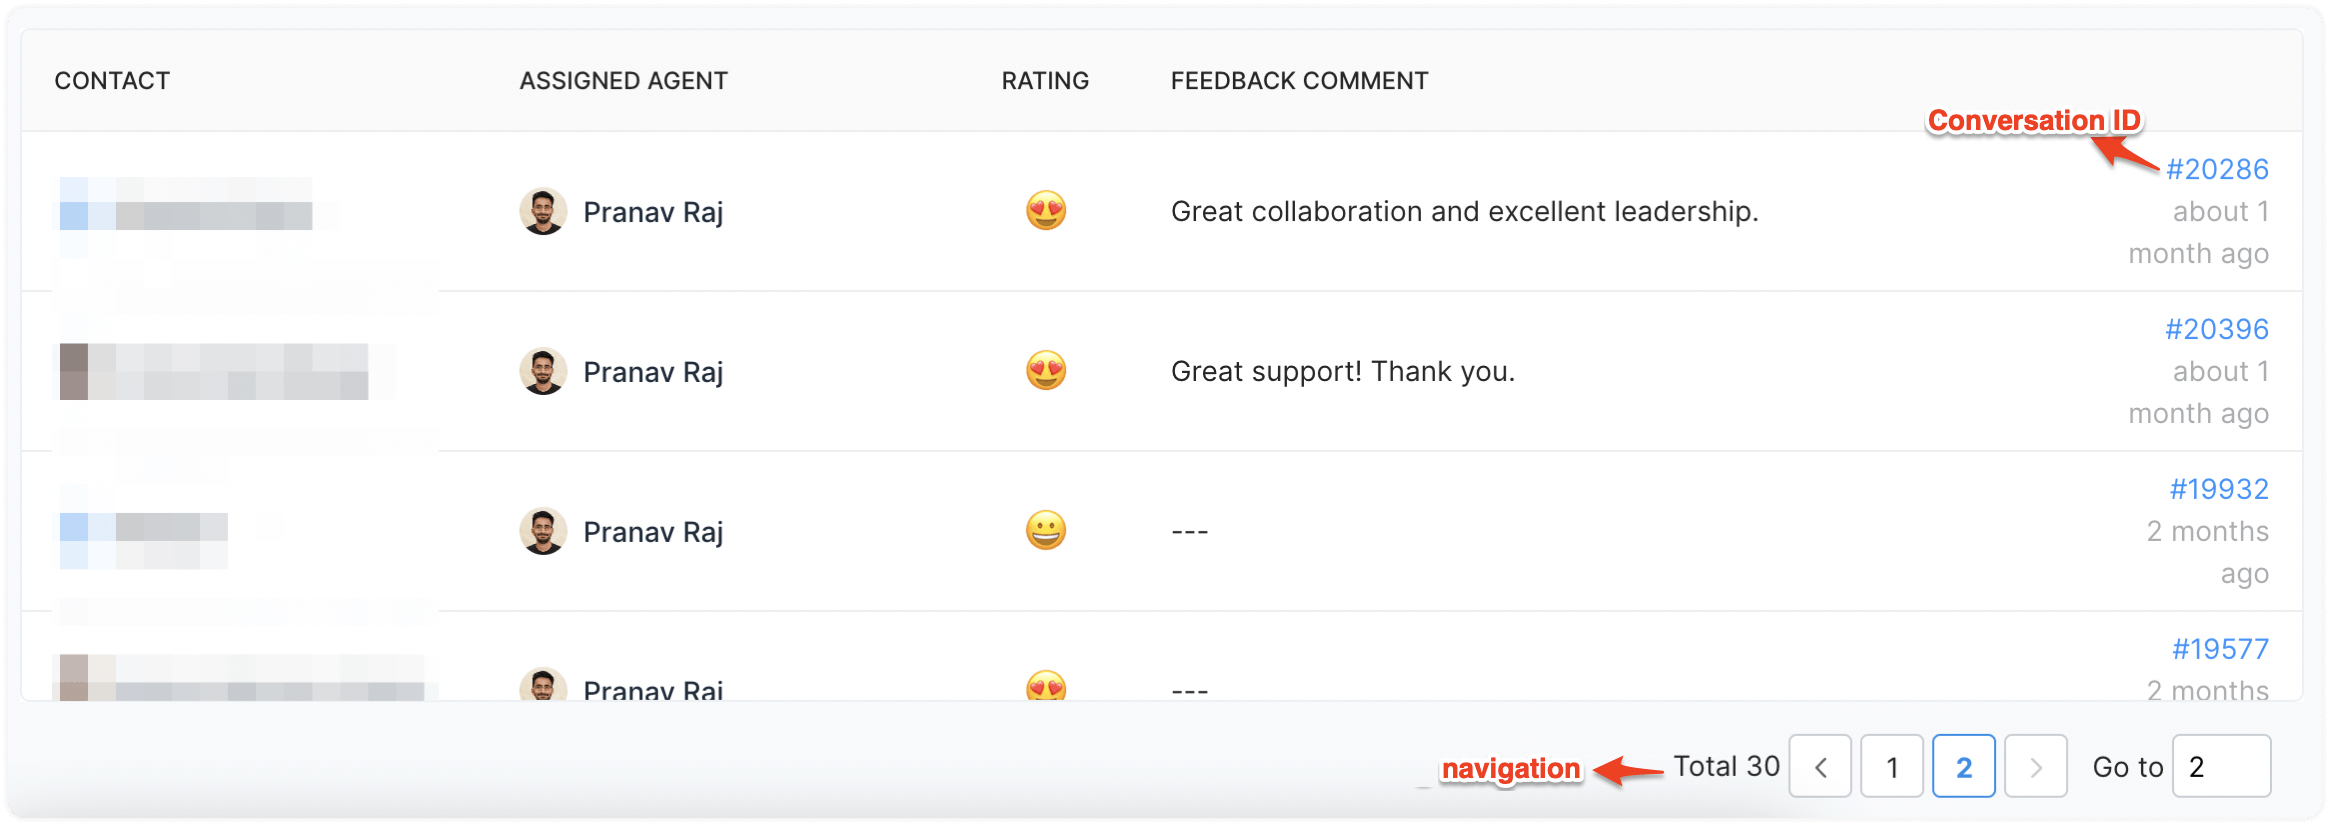
Tip: You can click on a conversation ID to jump to the associated conversation.